
The Saudi Spending Phenomenon – Will It Ever Stop?
The Saudi Spending Phenomenon – Will It Ever Stop? Ladies & Gentlemen, All Market eyes have been eyeing up Oil Prices, some are calling a further slump in 2016 and others are a bit more optimistic (seeking the $50 mark). However, with these lower prices, how has the World’s biggest Oil player reacted & will it really hurt the Saudi Economy? You would of actually never of guessed there to be an Oil slump from the shine of the Saudi economy and that is no accident, it is Saudi (well-planned) policies in action. The wealth from the Oil revenues has been shared and the public have firmly supported the Al Saud family, even as turmoil beckons on the horizon. The IMF predicts that within 5 years, the Kingdom will run out of Financial Assets… But is that really true (raised eyebrow)? In theory, if they continue to spend at the rate they are & Oil prices remain low, then yes! However, they currently stand at a (Positive) 100% net cash : GDP ratio & if you look at a Country like Japan, who’s net:GDP is -200%, I begin to differ with the IMF. Saudi literally are operating with no debt. figure : Bloomberg source Can this be protected for the Future? What if Oil prices continue to fall? I think you will start to see Saudi Arabia slowly decrease their heavy military contracts & begin opening their Economy up to foreign investment, by way of issuing Government debt or opening investment into Saudi stocks. More recently, the Saudi government to pull in about $70bn from Equity markets to begin adding more liquidity within their own markets – “Welcome world to the Tadawul”. We could also see (like Qatar) a higher increase in Western Property purchases… Again another indication for potentially more spending. Saudi issuing Debt? Really? How friendly would that be? Honestly speaking (ok – be careful here Anish #whips…) The country has been caged about opening it’s Markets to the World and if done, would be extremely gradual, as they drift away from traditions. Most Governments generally support their Economy, by way of tax receipts.However, over the past 3-4 decades, Saudi has been funded with Oil receipts Reality Check.. Oil still costs $3 to get out of the ground and with current production levels, Saudi are still generating $300-400bn from Oil revenues alone (at least)! It looks like the Saudi powerhouse is only going to get stronger, especially as Investors from around Asia flock in. The next 5-10 years will be critical for the Kingdom, to really impose its strength as the World’s largest Economy, alongside China. Trade Smarter & Best of Luck for the week ahead. Best wishesAnish @ Atom8FX
Kuroda’s Economic Armageddon
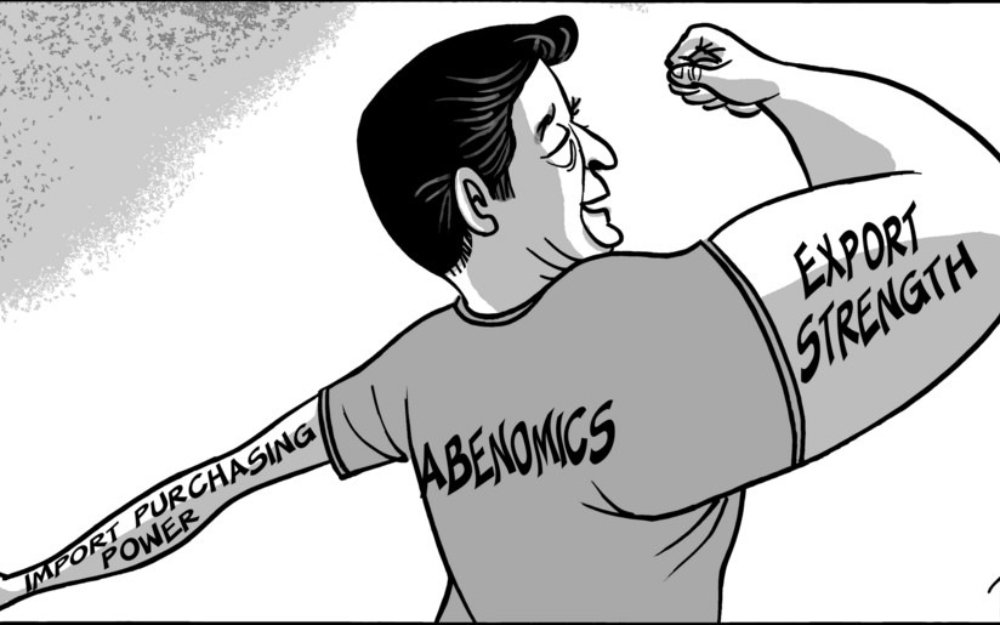
Kuroda’s Economic Armageddon Ladies & Gentlemen All market eyes will be focused on Japan tomorrow, as they release updated inflation forecasts. Essentially, this is an indicator of when, or if, the bank;s board members see Japan reaching their inflation target of 2% and markets are expecting the BOJ to become even more engaged in search of the 2%. The Markets over the past few weeks have priced in more stimulus, especially with the recent Nikkei gains. Kuroda has done an excellent job in albeit trying circumstances, elevating inflation expectations in an economy that has had actually 0 inflation in the last 20 years. Just cast your mind back to 2 years ago when the USDJPY was trading around 80 and now trading around 120 & Nikkei at 8,000 & now nearly 20,000 – really putting QE into Economic action – essentially reflating the risk/assets base. But still have a lot more positive inflation to go up to 2%. However, could we really see the BOJ wanting to weaken the Yen further? At the moment Japan is still very cheap & the major corporates have been rubbing their hands in Green for the past few years now – on the flip/side the small/medium companies have been feeling the pinch with greater import costs. In addition, policy markers are also adjusting for (and looking forward to) lower a base of lower oil prices, but again adding more stimulus could be more problematic in the longer term. In my view, the decision tomorrow is more likely to be felt within the Equity Markets as Kuroda focuses on building a significant amount of more wealth into the Nikkei and their is a high conviction level from traders that something will happen – Especially as Japan owns more than half of the nations ETFs (An important Abenomics Battleground) – But really where does true Economic Theory come into play here? Central Banks buying up ETFs to promote more “risk-taking activity in the Economy”… Overall, Japan has a very important lesson that they have probably been mislearning and it’s underlying issues could be 1 of 2 things… either Deflation or is it because they failed to act like the US did in the 90s. As Buffet once said“We are all Market Vigilantes” So what is the end game for the BOJ? Does AbeNomics fail trying to approach a 2% target that they may not ever hit. We face an absolute Economic Armageddon. In my view, a lot of Japanese pride on the line. Keep your eyes peeled & fingers on the right side of the trigger! Best of luckAnish @ Atom8.com
Could Monetary Policy Divergence cause EURUSD to hit parity by December?
Could Monetary Policy Divergence cause EURUSD to hit parity by December? Ladies & Gentlemen, We have heard it over and over again & now it is crunch time, where Economic theories come into practice and the Markets click to the tune of the Central Bank Announcements. Here is what ING predicted at the start of 2015 and low & behold how the year has turned out to map the below Over the last 12 months the Markets have remained bearish and the EURUSD has fallen from 1.40 to 1.05.. but why? And the concept is pretty simple to understand, as the FED stop QE at the same time of the ECB continuing their QE policies. This is known in the Markets as a “Divergence in Monetary Policy” and as the Markets price in their expectations of a FED non-hike, the divergence is set to continue… Implicating parity and if not parity, then sub 1.00. Vamvakidis, head of G10 Strategy at Bank Of America calls for EURUSD to hit parity by December 15 and also the USDJPY to hit 125. What needs to happen for EUR parity? Well, in order for this prediction to hold – the divergence needs to move further. If we get more QE by the ECB in December and the FED does not hike (which is very ikely) we could easily see parity. But the FED hike is a matter of time and could be as early as Jan 2016. The equilibrium of the EURUSD cross is around 1.15, however, the Euro zone still has a significantly large Output Gap compared to the US & if the ECB announces an “open ended” (or Infinity based QE) – that could stir up a recipe for disaster – as the Bears would then look to push down to 0.75. How do I trade these markets? Volatility remains high and it is mainly the bears driving the markets, supported by the facts pushed from Central Bank data this month. Looking at the bigger picture, the FED will eventually look to hike rates but more than likely, it will not be until next year – even though Domestic data has improved in the US, I would not expect anything significant this week. Keep your eyes on the data A balance between Domestic Developments & External Developments is key for the FEDs decision & once we do see the hike… the bad news will hit hard & remain bad news! Can I Jump on The Karoda Vs Draghi Trade?The international expectation is for more BOJ easing and if you look at the currently inflation rate in Japan, the BOJ should actually be doing more. The USDJPY currently is not that strong, either not that weak. However, it would be ideal to remain long the volatility as no matter what happens USDJPY will move! I wish you the best of luck with your Trades & hope you keep your fingers on the right side of your mouse triggers! Anish @ Atom8.com
The Vicious Downward Cycle of Oil

Ladies & Gentlemen Oil once more trades at a near 2-month low and as vicious as it has been, the oil price collapsing cycle does not look to be over just yet. However, large institutions and Central Banks further seek a longer period of stability, especially in the eyes of the Bond Markets. The US are still heavily over-supplied and refineries continue to close down, due to mounting costs from a alack of productivity. The big players are still looking at holding sub $50 and hedging their risk with the Futures Markets… These “players” may be the ones the Central Banks turn to in the near future to assist in the un-cuffing of this downward spiral. OPEC have been heavily pressured by Venezuela (Country with the World’s largest known Oil reserves) to do something about the Oil price and have been supported by one of Africa’s biggest Oil producer, Algeria. Contrary to views from the Gulf who are welcoming the lower prices, seeing it as a chance to reform & these contrast of views continue to bear onto a larger Geo-Political issue. But how big is this issue? Saudi Arabia, the world’s largest Oil mover has been doing things recently, that in the last 30 years have been unimaginable ;1. Withdrawing money from overseas;2. Delaying contract payments; and3. Taxing lands. So how does the Market quantify these issues?.. Let’s pause for a second and cast our mind backs to mid 2007 when the Oil price hit $145.00 per barrel and the Gulf generated more money that they knew what to do with & the fact remains that Saudi’s Debt:GDP ratio is still less than 2% and in the next 10 years is estimated to stay below 7%… The main Gulf states could actually live comfortably for several years from these revenues built. So contrary to the “Geo-Politics” – Investors are more focused on the supply-side issues and may be more keen to ignore the political nature surrounding the MENA regions. Storage is still reaching tank-tops and if this trend continues, we may see for the first time in 20 years – oil investments declining for two consecutive years and this may be an indication for future oil markets.. as they look to continue their downward spiral. Optimists still seek a bottoming level – looking at Iran supplies for next year to help boost $60+ for 2017 (perhaps a fascinating new dynamic for the near future), however the fundamentalists outlook is further lower to find a strong re balance in the market. Best of luck Anish
Calls in from the Trading Floor – Hold your Oil Shorts!
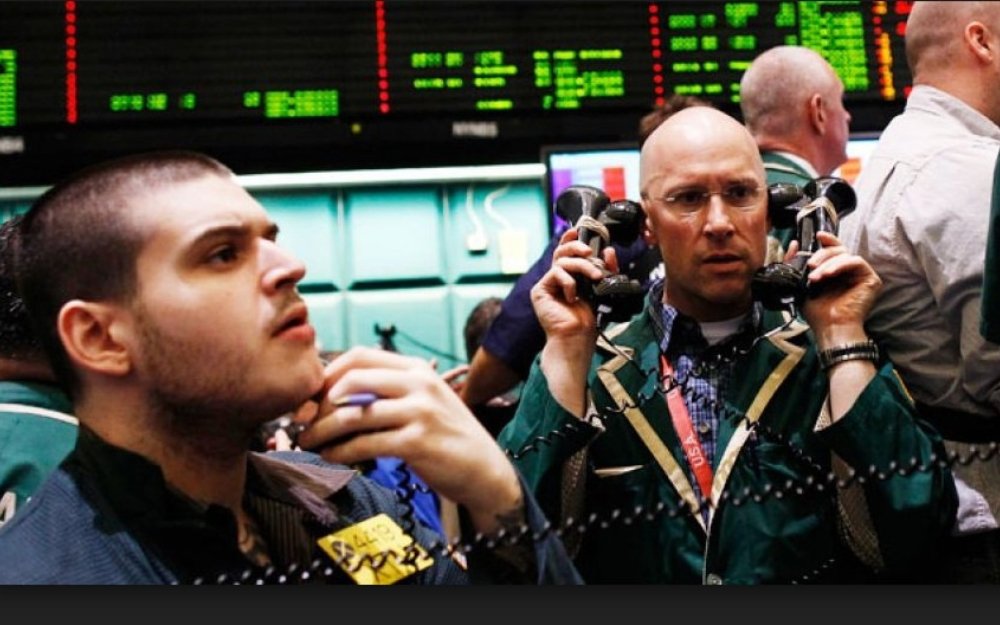
“Hold your Oil Shorts” Calls from the Floor Ladies & Gentlemen As our eyes turn to the weekend – the volatile weekly Oil market draws to a close after a neat 10% slide on the back of further global supply gluts. From my post labelled “Crude Oil – A Bargain Hunt” the larger oil producing nations are looking at the $50 mark as the benchmark heading into 2016. However, the institutions & techies are looking at $50 as a perfect opportunity to remain short. So how are the Traders actually clicking? Well.. the more short-term clickers are looking at more downside targets, however some trading puritans would argue about the risk:retun. Although, as i Look at the chart & price action this morning, you can see that the market is heavily gripped by short covers. Hence the phrase “if I can scoop a small profit I will take my money and run” in my original post. Looking at a first target of $46.90 and would target ever 5 cent fall beneath this level. Tempted to leave this short open for the rest of the day heading into early next week – especially after 4 days of straight decline. WTI is set to make its steepest weekly loss in 10 weeks and Brent in 8 weeks. The Market is expected to remain heavily over-supplied heading into 2016 & sadly for the Oil companies – The Facts do not lie! Some Oil optimists are hoping that Shale production forecasts are on the decline, as output is geared towards a fall in November and also data from the EIA showed gasoline stocks falling by 2.6 mio barrels per week. Best of luck with your positions AnishFX @ Atom8.com
Gold : A Mastermind of the “Break-Out” – $1300 by 2016?
Gold : A Mastermind of the “Break-Out” – $1300 by 2016? Ladies and Gentlemen The precious yellow metal is back in the spot light after forming a pretty dull range so far this year between $1200.00 / $1100.00 and the outlook has remained bearish. However, this has all changed in the past few days as the October Bull awakens to the more uncertain Economic landscape, especially breathing from the US & from increased Geo-political action (The Ruski’s in particular)! Gold (XAUUSD.v) is showing strength above 1170 (formed yesterday) and all my indicators are pointing towards a further bull offensive. The commodity must continue to trade & hold above it’s broker resistance (turned support) at 1170 to really create more scope for strength heading into the final months of 2016. On the other click, if you remain a bear in this market – support comes in more at the 1165 level, where a break down to 1150.00 will really slam the brakes again on the metal. Me personally, I am hoping for a break of 1200 as I really do miss the days of huge Gold daily volume. fig: Atom8 MT4 Terminal How high could we go? After breaking a “key resistance” level, the investor sentiment is more positive and will probably attempt to push it to a high for year-end. Gold is now trading above it’s 200-day MA for the first time since May & prices could be further buoyed by (what is now expected to be) weaker US data & that the FED are now looking to raise rates next year. A call for above 1200.00 could be realistic by December and I would not be surprised if we even saw a move to the $1,300 mark – as volume for Metals expect to be double by next year (source : mining.com). Best of luck Traders, Anish @ Atom8.com
All Aboard the Roller-Coaster that is Cable

Ladies & Gentlemen In the last 24 hours we have witnessed one of the most wildest days for Cable, with a near 200 pip swing – behaving more like a “spoiled kid” trading FX for the first time. We moved to 1.5390 when the AB InBEV / SAB Miller deal (now the world’s biggest brewery) was announced before a sharp move to 1.5210. UK employment data this morning has kept calmer the beast that could form this month in Sterling as it is held below 1.53… For now at least! The UK ILO Jobless rate was posted at 5.4%, actually the lowest since mid-2008… giving a further insight into an all important component for the UK employment sector, as people get their butts into work before Christmas. So what are the important intra-day levels to watch? Well the initial hurdle of 1.53 is clear and above that to really prove bullish power would be 1.5345, where the 200-Day SMA marks. However, a breakdown in Cable this week could fast see an exposure of 1.5107 – the low from October 1st and then a bearish eye towards the 1.50 levels once more (lows of May & also key psychological support). What is the Future for Cable? – Again the long-term dynamics of £/$ are likely to be determined by the continued debate around rate hikes and as we all know the global economy is slowing slightly and this slow-down could backlash on the UK as well as the USA. The near-term bias could still be on the down-side. Wishing you the best of Luck Anish 8FX
Crude Oil – A bargain hunt heading into 2016?
Dear Traders As we enter the final quarter in 2015, investors are watching the price of Crude Oil with an eagles eye. Oil prices have been on a roller-coaster ride over the past few weeks, coming from 6-year lows and with talks of $30 per barrel (being the new normal) a few months ago, we have seen a remarkable comeback as the $50 mark was crossed for the first time since July. It looks like more short-term players have seen this opportunity above $50 for greater profit-taking and more sizable positions seem to have taken the market back to $47 & if this price is not screaming for a “Pull-Back” before year-end.. I don’t know what is! However, more “conservative” fundamentalists focused on the over-supplied commodity are ignoring the price action and looking at more longer-term consolidations up to year-end & maybe till future rate-hikes – the recent drop in oil-rig counts did not help either! OPEC remain firm that demand should begin to increase in early 2016 and this should naturally reduce the worried over-supply figures, resulting in a more “balanced” market – which if true, should see investors price in a more bullish price action heading up to year-end. However, warnings persist from the International Energy Agency insisting over-supply is set to stay. Although this view did not stop the Chinese “Bargain Hunters” from buying up more of the market last month. With Russia now heavily involved in Syria and also stamping its foothold around the Middle-East’s perimeter, the geo-political dynamics of the Oil Markets have a new found tension from the prospect of a potential stand-off between the US & Russia, as Russia looks at prioritizing it’s hand in the Middle-Eastern Crude supply.Recent ISIS attacks on production facilities in Norther Iraq have also added to this dynamic and of course, oil nations and businesses are keeping this in mind when attempting to analyse their quarter-end plans. Overall, it is important to note that there is still an oversupply (surplus of around 1 million barrels per day). However, the “rebalance” force should help calm this supply over the next 12 months, where a turn upwards of $70-75 would really indicate a rebalanced market. Trade OIL with Atom8Atom8 are now proud to announce the launch of USOIL as a new CFD on their leading MT4 terminal. Spreads start from 1 pip and if you would like to test the core pricing, please email info@atom8.com
The most important NFP of 2015

Ladies and Gentlemen Today at 13.30 BST we get the latest employment report from the United States, it will assist government policy makers in their quest to decide on the timing of the first rate rise since 2006. The change in Non-Farm payrolls is expected to be 217k according to the Bloomberg Survey, the report is seen as the deciding factor for the September FOMC. Commentators believe the chances of ‘lift off’ have diminished in the light of the financial turmoil, however the employment survey was concluded before this period. The August number is heavily influenced by seasonal factors and difficult to predict. Over the last 10 years the difference between the consensus and the actually number has been biggest in both March and August, there was a 119k miss in March of this year let’s hope we are closer for August. It is important to remember the dual mandate of the Fed, meaning that both employment and inflation will have to be at levels where tightening monetary policy is appropriate. The unemployment rate which has already reached the top end of the Fed’s year end projection 5.2%, is a 7 year low. However, a falling oil price means away from the workforce there is a disinflationary environment and may enable the key decision to be delayed. At Atom8 we are cognisant that this is an important number and that it is worthwhile looking at all the data that is released at 13.30 including the July revisions. Good Luck
As the #BOE “Super Thursday” approaches.. What shall we expect to see?
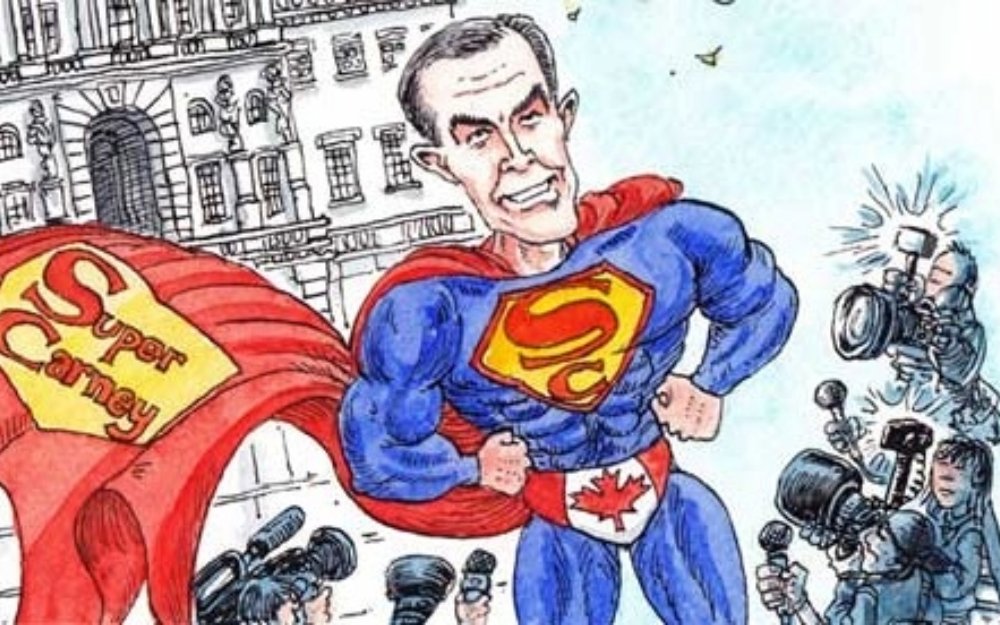
Ladies and Gentlemen, If you look at the list of data being released tomorrow in the UK, you will see why the media are referring to it as ‘Super GBP Thursday’. 09:00 New Car Registrations 09:30 Industrial Production Manufacturing Production 12:00 Bank of England Inflation Report and Minutes to the meeting Bank of England Bank rate (0.5%) We get 3 data points from the BOE at midday, the minutes of its policy meeting, the quarterly inflation report forecast and the Interest rate decision, presently 0.5%. Normally, these reports are on separate days. What should we be looking out for? How the members of the MPC vote, the last 7 meetings have been 9-0. Are there any dissenters in the ranks? Martin Weale confirmed he was one of two members that nearly voted for rate rise at the last meeting and JP Morgan have forecast a 6-3 vote. Who are the other possible dissenters? Kristin Forbes said there will be a rate rise ‘in the not too distant future’. However I take note from the BOE chief economist Andrew Haldane ‘ For me the combination of a healing economy, very low price pressures and a wobbly world means there is no rush to move rates from where they are now’. It is important to remember that the BOE mandate is to deliver price stability and then support growth and employment. It will a very interesting day as the market presently expects a rate rise in May of next year, if the hawks win then 1.5680 is the level to watch whilst a leaning towards the doves would see 1.5470 tested. Good Luck